Although the shot noise increases with the signal, its relative contribution reduces
As discussed in the first blog in this two-part series, in shot-noise-limited applications, a higher full-well leads to a better signal-to-noise ratio (SNR). The shot noise is proportional to the square root of your signal in electrons. Although the shot noise increases with the signal, its relative contribution reduces
In the previous blog, we compared the theoretical full well of the Q-12 (CMV12k), Q-21 (GSPRINT4521), and the GMAX2509 (see table below). This comparison showed that the Q-21 in maximum full well configuration has the largest full well and thus the highest SNR.
Let’s not only look at what can be expected from theory but also perform some measurements and look at the influence of shot noise on them.
Acquisition Conditions
All three cameras were illuminated with the same uniform light source and the same light intensity. Due to the difference in pixel size, full well and sensitivity, the exposure time was different for each sensor configuration. It was varied to get to a video level of about 75% from the maximum. The table below summarizes the required exposure times to reach this 75%. For each configuration described in the table, we shot a single image.
| Camera | Maximum full well [e-] | Exposure [us] |
| Q-21 max full well | 33.6k | 9100 |
| Q-12 | 8.5k | 3050 |
| GMAX2509 max full well | 6.7k | 5772 |
| Q-21 high sensitivity | 7.0k | 1980 |
What We See
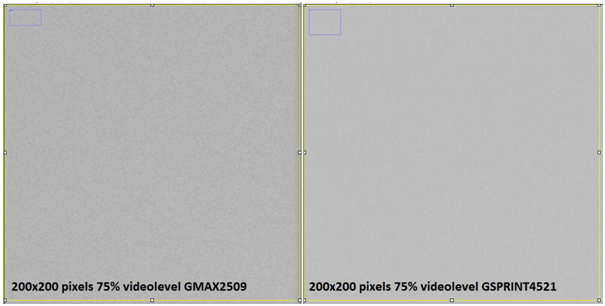
Below, we show the image from two of the four sensor configurations. Comparing an equally sized region of interest and using the same contrast settings, the comparison between the GMAX2509 and GSPRINT4521 (max full well mode) shows a clear difference in their noise.

Line Profiles
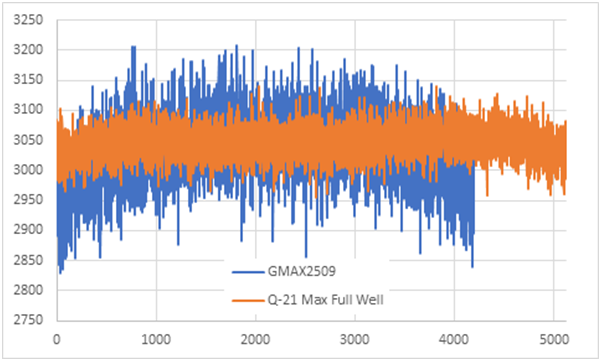
If you can see the shot noise in the 2D image, you can also show it in a cross-section of that image. In the line profile image below, you see the larger high frequency signal variation for the sensor with the lowest maximum full well. There is also the lower frequency shading variation. For this article, however, that’s not the main focus.

The Histograms
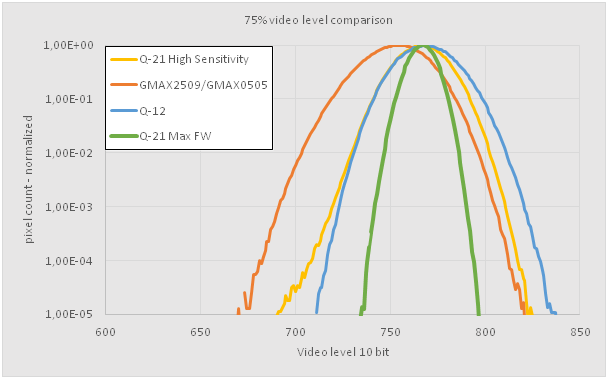
To compare more than two sensors, looking at the histogram of their images is likely the clearest method. For each of the sensors, we normalize the histogram to the maximum. This normalization keeps the shape of the histogram the same and makes it easier to compare sensors with different resolutions. The resulting normalized histograms are shown in the plot below.

Clearly the width of the histogram is different for each sensor configuration. We used the same light source for the measurements, so differences in light source uniformity cannot explain this difference.
As we have seen from the line cross section earlier, the sensor uniformity has a small influence. However, most of the variation can be attributed to the shot noise. This is a different way to visualize the high-frequency variation as visible in the line cross-section.
Note as well that at 75% video level, the shot noise significantly overpowers the read noise. For example, the shot noise for the Q-21 in high sensitivity mode is about 73 electrons, while its read noise is only three electrons.
In this uniform condition, the width of the histogram is a direct measure for the signal to noise ratio. The wider the histogram, the worse the SNR. As expected by the theoretical curve plotted in the previous blog, you can see that the Q-21 — due to its highest full well in the max full well mode —clearly provides the thinnest histogram and thus has the best SNR. The Q-12 lands in second place, and the Q-21 in high sensitivity mode in third, with the last place for the GMAX2509.
In Conclusion
This blog is not to say one sensor is better than the other. Shot noise is not influenced by the quality of the sensor, but determined by the full well size, which is just one of the many design parameters.
Often, cameras with a lower full well have a higher sensitivity. The GSPRINT4521 adapts to this in a single sensor by providing an operating mode with a high full well and one with high sensitivity. This makes the sensor suitable for a wider range of measurements.
Thankfully, at Adimec, we’re well equipped to address any of the above considerations. Our experts are ready to ensure the best possible integration into your systems — we look forward to hearing from you!
 English
 日本語
日本語 简体中文
简体中文


Hello sarannejacobs,
thank you for your excellent work on this blog post. There is one part in specific I am missing out: What about the dynamic range. If I compare two sensors with the same dynamic range, but different full well capacities what will be the result?
My thoughts: The Q-12 (CMV12k) has a dynamic range of 60 dB with a full well capacity (fwc) of 13500 e in comparison to the GMAX2509 with 65.5 dB @12 bit with fwc of 6700 e. The 6 dB more dynamic range of the latter is a doubling of the dynamic range! So I would guess if you test these two (GMAY and Q-12) the GMAX would perform better, despite its lower fwc?
In your graphic you compare the GSPRINT4521 Q21 with the GMAX2509 . The Q21 comes with a dynamic range of 68 dB in comparison to the 65,5 of the GMAX2509 . So despite having the biggest fwc it also features a the highest dynamic range. So a better performacne was expected also due to the higher dynamic range. So in short I am not sure if the better performance is grounded in the higher fwc or just because the dynamic range is the highest? (around 33% increase*)
(Also in yoru first blog you state that the Q-12 has about 10k electrons. In the datasheet I found 13500 e. And in this post, in the provided table, you state 8.5k e. That confuses me a bit, what am I missing out?)
Best regards and thank you in advance
Marius
* 68 dB – 65,5 dB = 2.5 dB difference ->10^(2.5/20)=1.3335