The design of a vision system starts with the selection of an image sensor. One of the main characteristics of an image sensor is its PLS (Parasitic Light Sensitivity) value. In our previous blog we explained the PLS value in more detail. How much influence PLS has on your system depends on the type of measurement you want to do. This blog focuses on two major factors that influence the effect of PLS on your measurement: exposure time and sensor readout time.
Exposure time
To demonstrate the effect of exposure time on PLS, we have done some measurements with a S-25A30 camera. First, we captured an image with an exposure time of 50 µs in 8 bit, see Figure 1. We enhanced the brightness and contrast of this image to make the PLS more visible. The line profile plot of the vertical yellow line, shows that the video blevel increases from 14 DN8 (top of the image) to 23 DN8 (bottom of the image). Thus, the PLS effect creates a difference of 9 DN8 across the image.
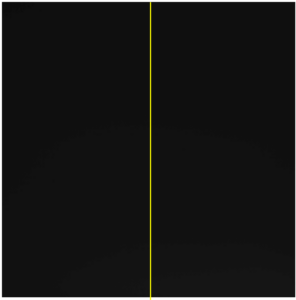
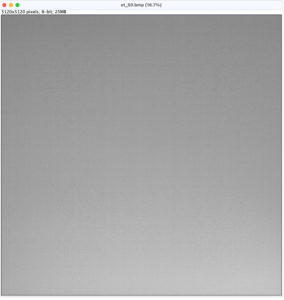
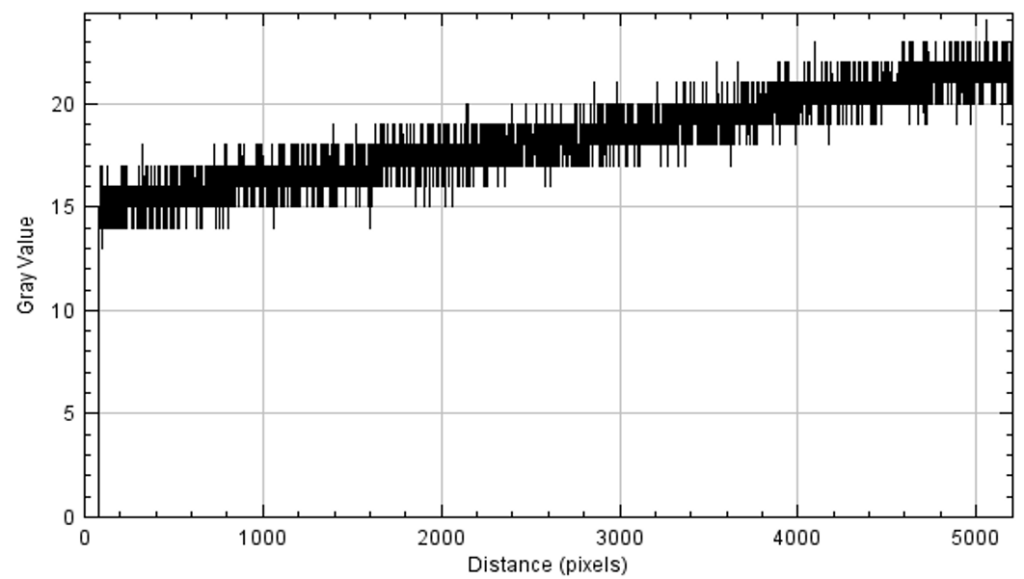
Figure 1: An image grabbed with an exposure time of 50 µs (a); Brightness and contrast enhanced version of the image (b); Vertical line profile (yellow line) (c).
Next, we captured an image using an exposure time of 1500 µs in 8 bit. As can be seen in Figure 2, the vertical line profile does not increase linearly.
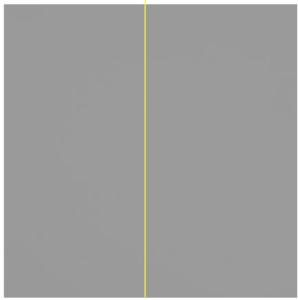
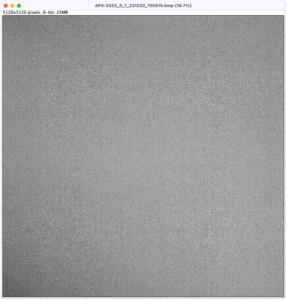
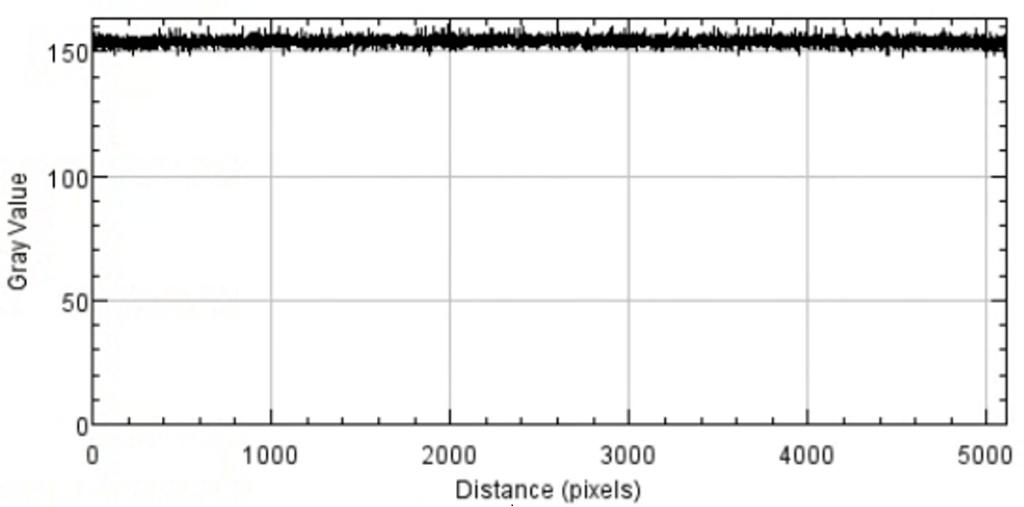
Figure 2: An image captured with an exposure time of 1500 µs (a); Brightness and contrast enhanced version of the image (b); Vertical line profile (yellow line) (c).
Does this mean that the PLS effects dissappear with longer exposure times? No, it does not. The amount of parasitic photons is the same. However, their relative contribution decreases as more photons are collected during the exposure time.
Sensor readout time
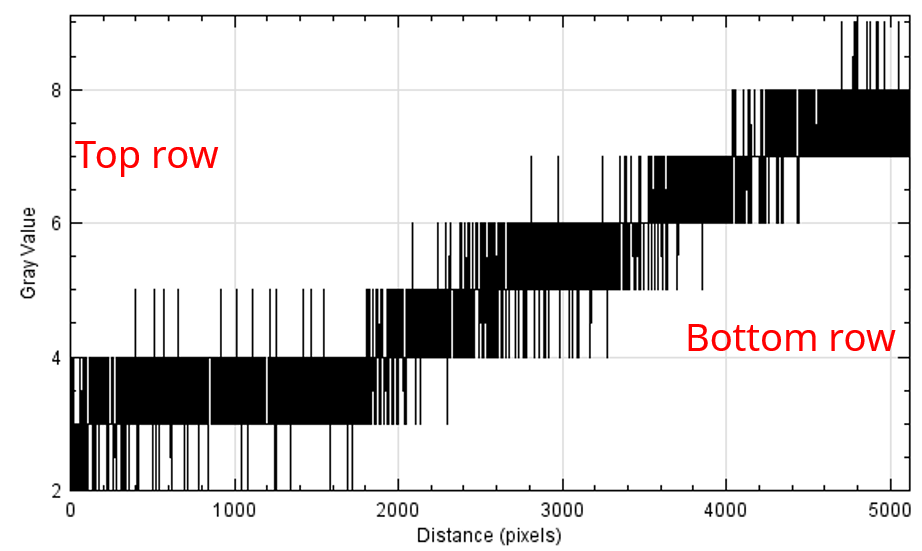
Another factor that directly influences PLS, is the sensor readout time. To demonstrate this, we tested a S-25A80 camera and changed the CXP configuration. The exposure time is set to 50 µs. The framerate is set to 10 fps and the same light source was used in both measurements. Figure 3 shows two vertical line profile plots from the resulting images.
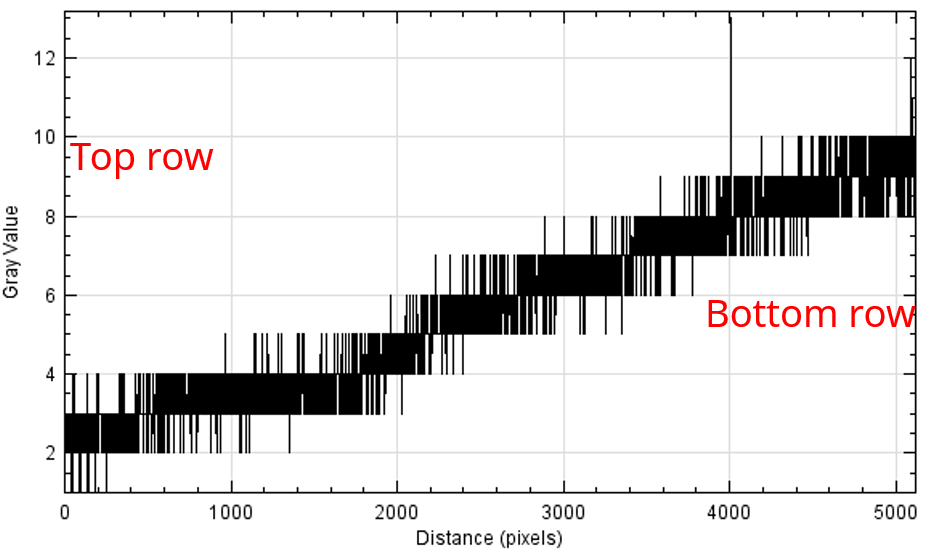
When the connection configuration is set to CXP3_X2, the sensor readout time is 43.5 ms. The line profile in Figure 3(a) shows that in this configuration, the video level increases from 1 DN8 (top row) to 13 DN8 (bottom row). Thus, at this readout time the PLS effect creates a difference of 12 DN8 across the image.
When the connection configuration is set to CXP6_X4, the sensor readout time decreases to 12.5 ms. The line profile in Figure 3(b) shows that in this configuration, the video level increases from 2 DN8 (top row) to 9 DN8 (bottom row). This results in a difference of 7 DN8 across the image. Thus, decreasing the sensor readout time also decreases the PLS effect.
Other factors
Two other factors that influence PLS are the wavelength of the light source (PLS increases with longer wavelengths) and the angle of the incident light. Sensor suppliers sometimes supply additional information about these factors that can help you to design your application.
Conclusion
PLS is a characteristic of the image sensor and cannot be changed. However, the effect of PLS on your application can be reduced by careful design considerations such as the selection of the light source and its alignment (wavelength, angle) and the conditions of the measurement (exposure time, sensor readout time).
 English
 日本語
日本語 简体中文
简体中文


